Comments
Here’s my attempt to summarise some of the discussion that Ryan Briggs and Gregory Lewis instigated in the comments of this post, and the analyses it prompted on my end – as requested by Jason [Should I add this to the original post?]. I would particularly like to thank Gregory for his work replicating my analyses and raising several painful but important questions for my analysis. I found the dialogue here very useful, thought provoking, and civil -- I really want to thank everyone for making the next version of this analysis better.
Summary
- The HLI analysis of the cost-effectiveness of StrongMinds relies not on a single study, but on a meta-analysis of multiple studies.
- Regarding this meta-analysis, some commenters (Ryan Briggs and Gregory Lewis) pointed out our lack of a forest plot and funnel plot, a common feature of meta-analyses.
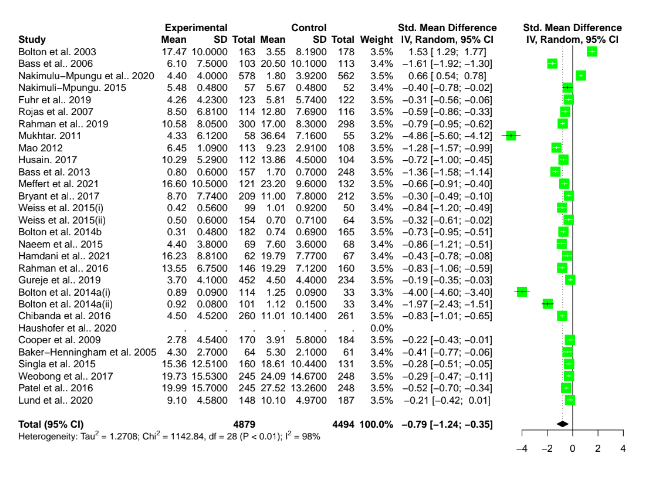
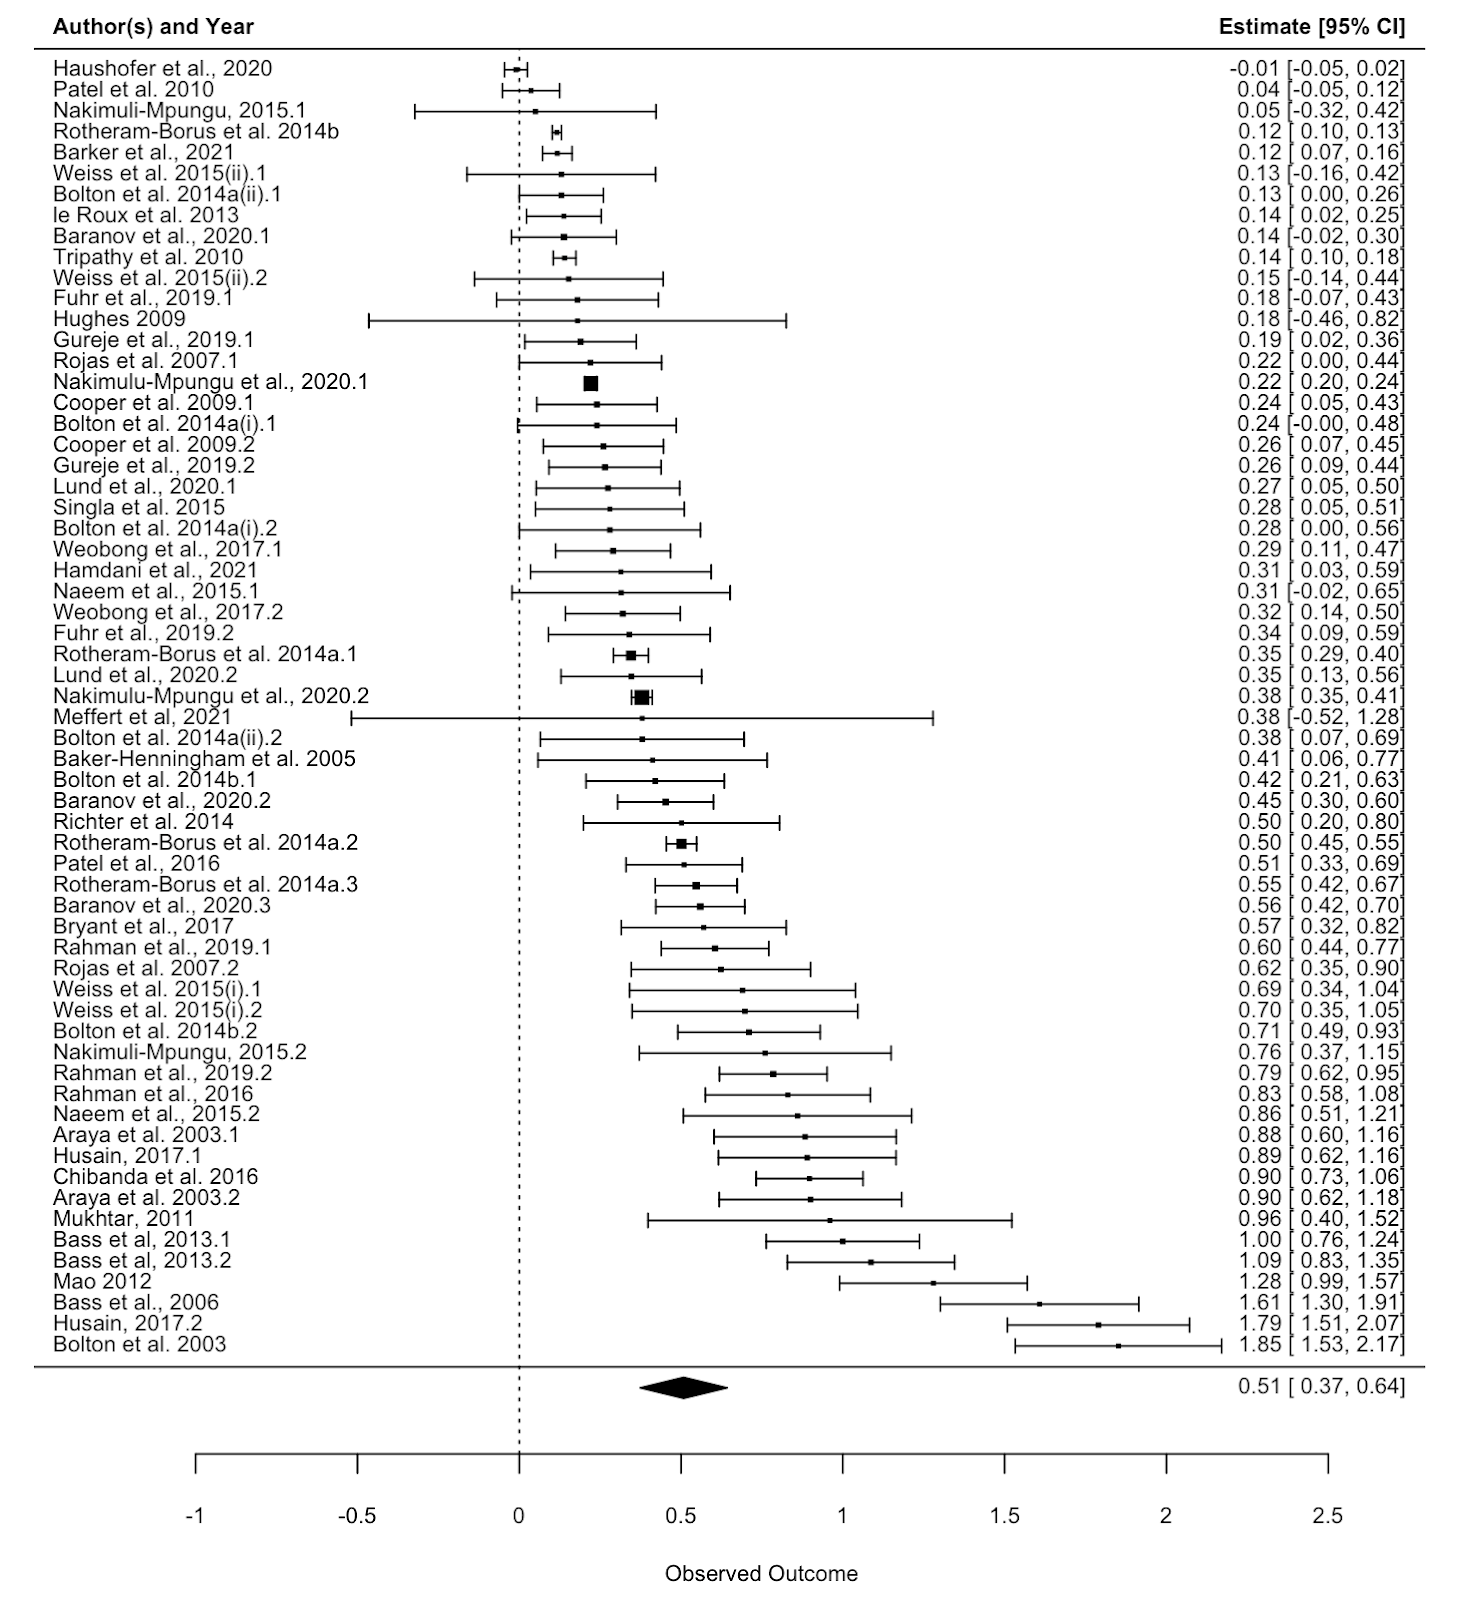
- Including a forest plot shows some outlier studies with unusually large effects, and a wide variance in the effects between studies (high heterogeneity).
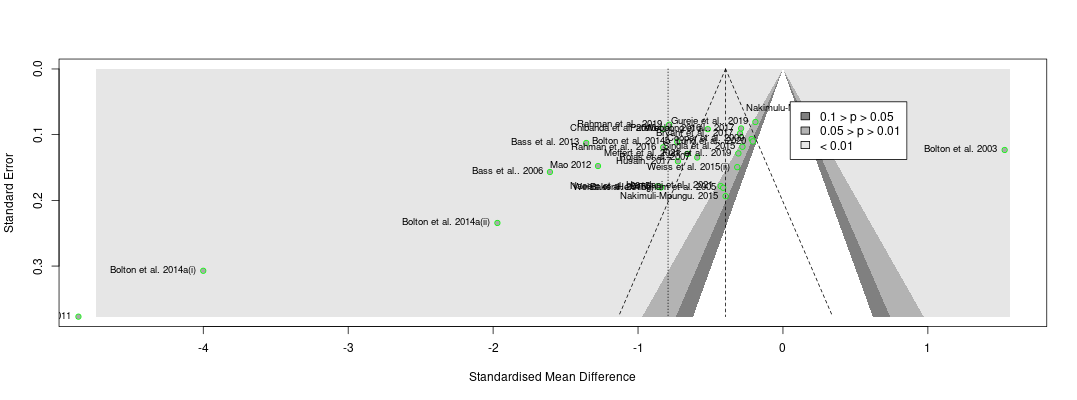
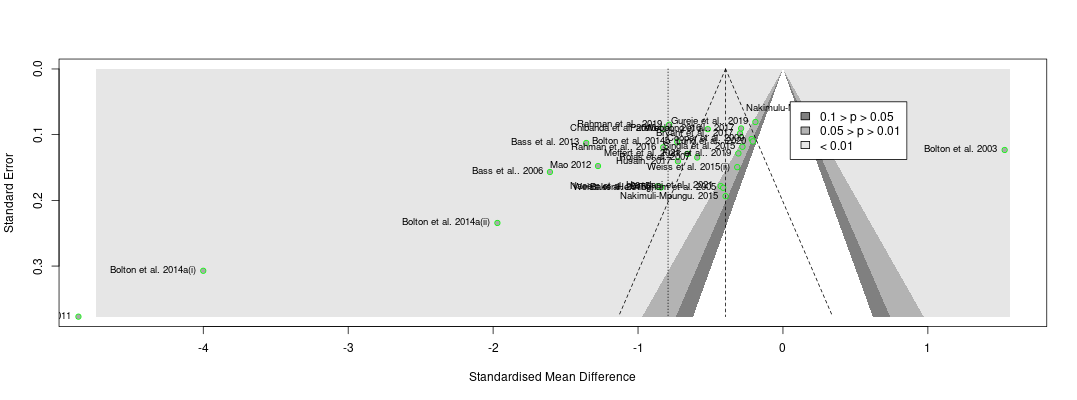
- Including a funnel plot shows evidence that there may be publication bias. Comparing this funnel plot to the one for cash transfers makes the diagnosis of publication bias appear worse in psychotherapy than cash transfers.
- My previous analysis employed an ad-hoc and non-standard method for correcting for publication bias. It suggested a smaller (15%) downward correction to psychotherapy’s effects than what some commenters (Ryan and Gregory) thought that a more standard approach would imply (50%+).
- Point taken, I tried to throw the book at my own analysis to see if it survived. Somewhat to my surprise, it seemed relatively unscathed.


- After applying the six standard publication bias correction methods to both the cash transfer and psychotherapy datasets in 42 different analyses, I found that, surprisingly:
- About half the tests increase the effectiveness of psychotherapy relative to cash transfers, and the average test suggests no adjustment.
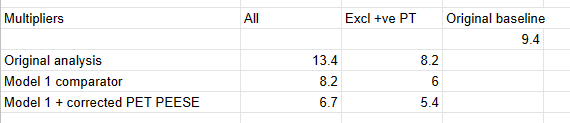
- Only four tests show a decrease in the cost-effectiveness ratio of psychotherapy to cash transfers below of 9.4x → 7x.
- The largest reduction of psychotherapy relative to cash transfers is from 9.4x to 3.1x as cost-effective as GiveDirectly cash transfers. It’s based on the older correction method; Trim and Fill.
- I have several takeaways.
- I didn’t expect this behaviour from these tests. I’m not sure how I should update on using them in the future. I assume the likeliest issue is that they are unreliable in the conditions of these meta-analyses (high heterogeneity). Any thoughts on how to correct for publication bias in future analyses is welcome!
- Given the ambivalent results, it doesn't seem like any action is urgently needed (i.e., immediately pause the StrongMinds recommendation).
- However, this discussion has raised my sense of the priority of doing the re-analysis of psychotherapy and inspired me to do quite a few things differently next time. I hope to start working on this soon (but I don’t want to promise dates).
- I’m not saying “look, everything is fine!”.I should have investigated publication bias more thoroughly in the original analysis. The fact that after I’ve done that now and it doesn’t appear to suggest substantial changes to my analysis is probably more due to luck than a nose for corners I can safely cut.
1. The story so far
In the comments, Ryan Briggs and Gregory Lewis have pointed out that my meta-analysis of psychotherapy omits several typical and easy to produce figures. These are forest plots and funnel plots. A forest plot shows the individual study effects and the study effects. If I included this, it would have shown two things.
First, that there is quite a bit of variation in the effects between studies (i.e., heterogeneity). What heterogeneity implies is a bit controversial in meta-analyses, and I’ll return to this, but for now I’ll note that some take the presence of high heterogeneity as an indication that meta-analytic results are meaningless. At the other end of professional opinion, other experts think that high heterogeneity is often inevitable and merely warrants prudence. However, even the most permissive towards heterogeneity think that it makes an analysis more complicated.
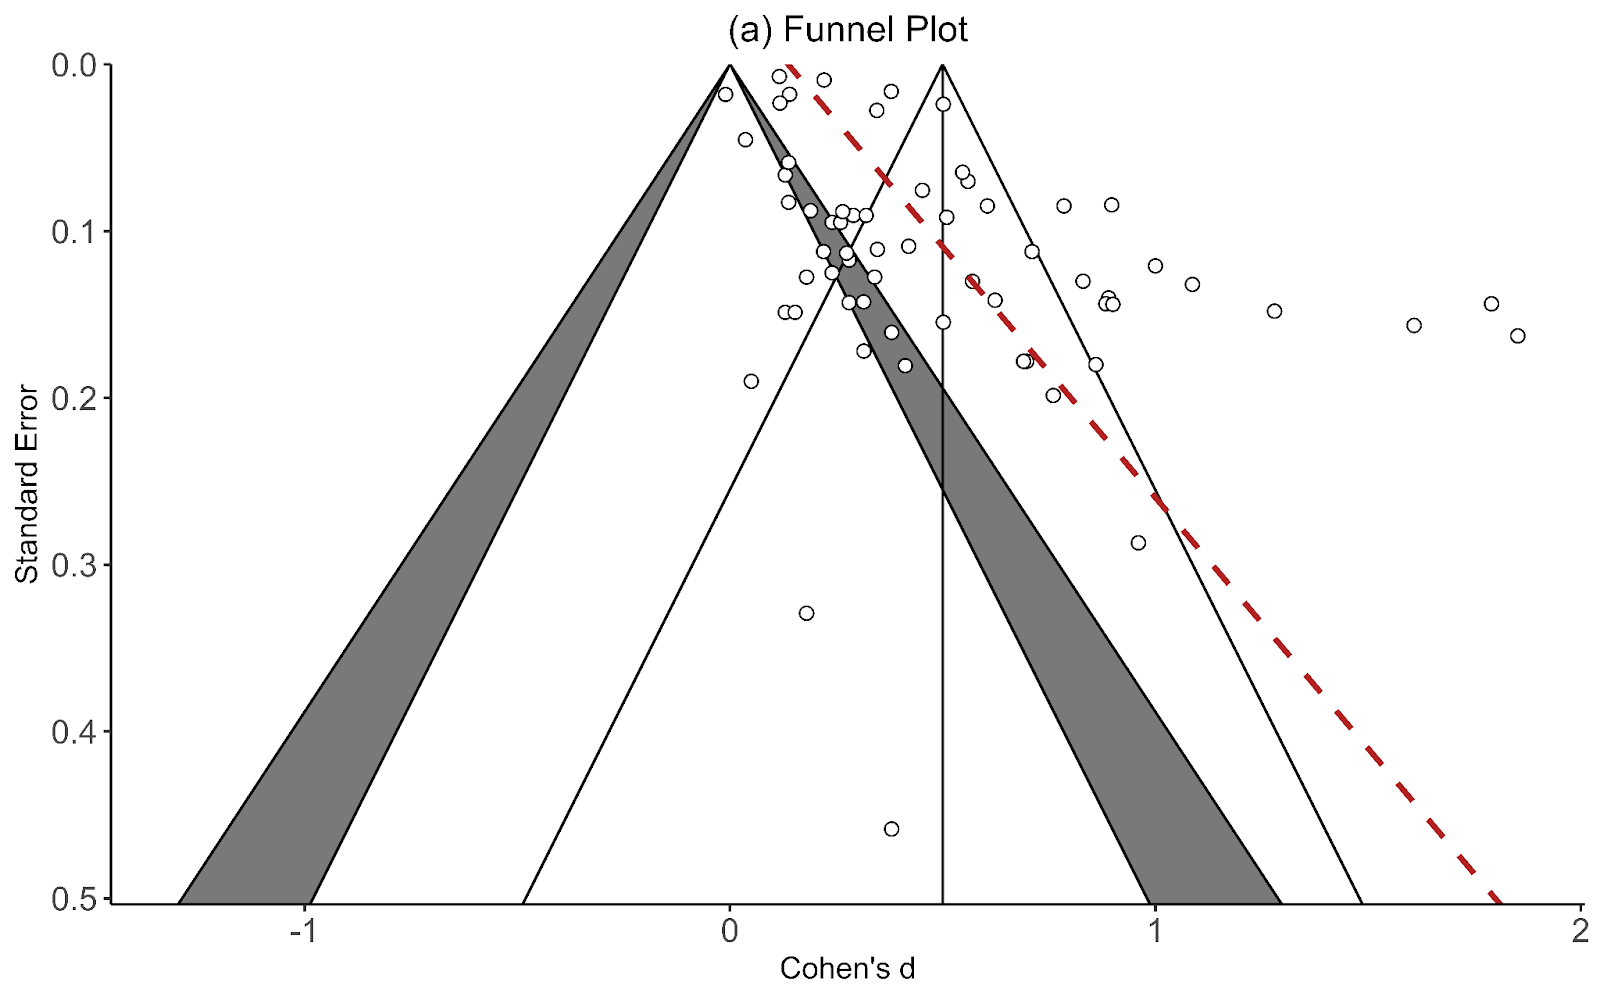
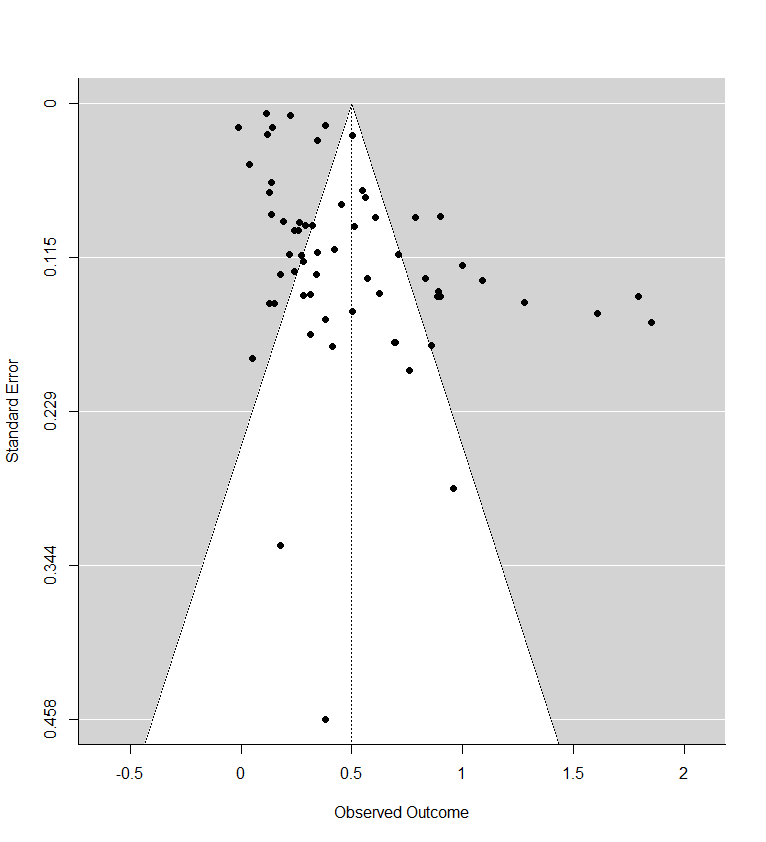
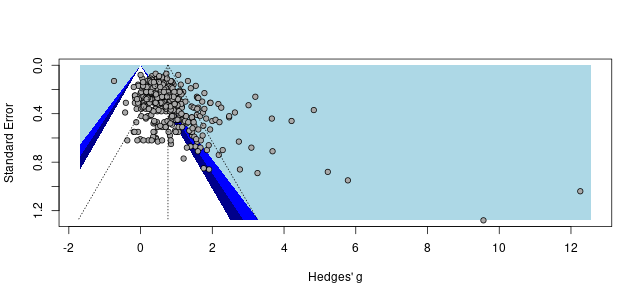
The second thing the forest plot shows is that there were a few considerable outliers. Notably, some of these outliers (Bolton et al., 2003; Bass et al., 2006) are part of the evidence I used to estimate that StrongMinds is more cost-effective than the typical psychotherapy intervention in LMICs. The other figure I omitted was a funnel plot. Funnel plots are made to show if there are many more small studies that find large effects than small with small, null or negative effects than we would expect due to a random draw. In the funnel plots for the psychotherapy data, which Gregory first provided by using a version of the the data I use, he rightly pointed out that there is considerable asymmetry, which suggests that there may be publication bias (i.e., the small sized studies that find small, null, or negative effects are less likely to be published and included than small studies with larger effects). This finding seemed all the more concerning given that I found pretty much no asymmetry in the cash transfers data I compare psychotherapy to.
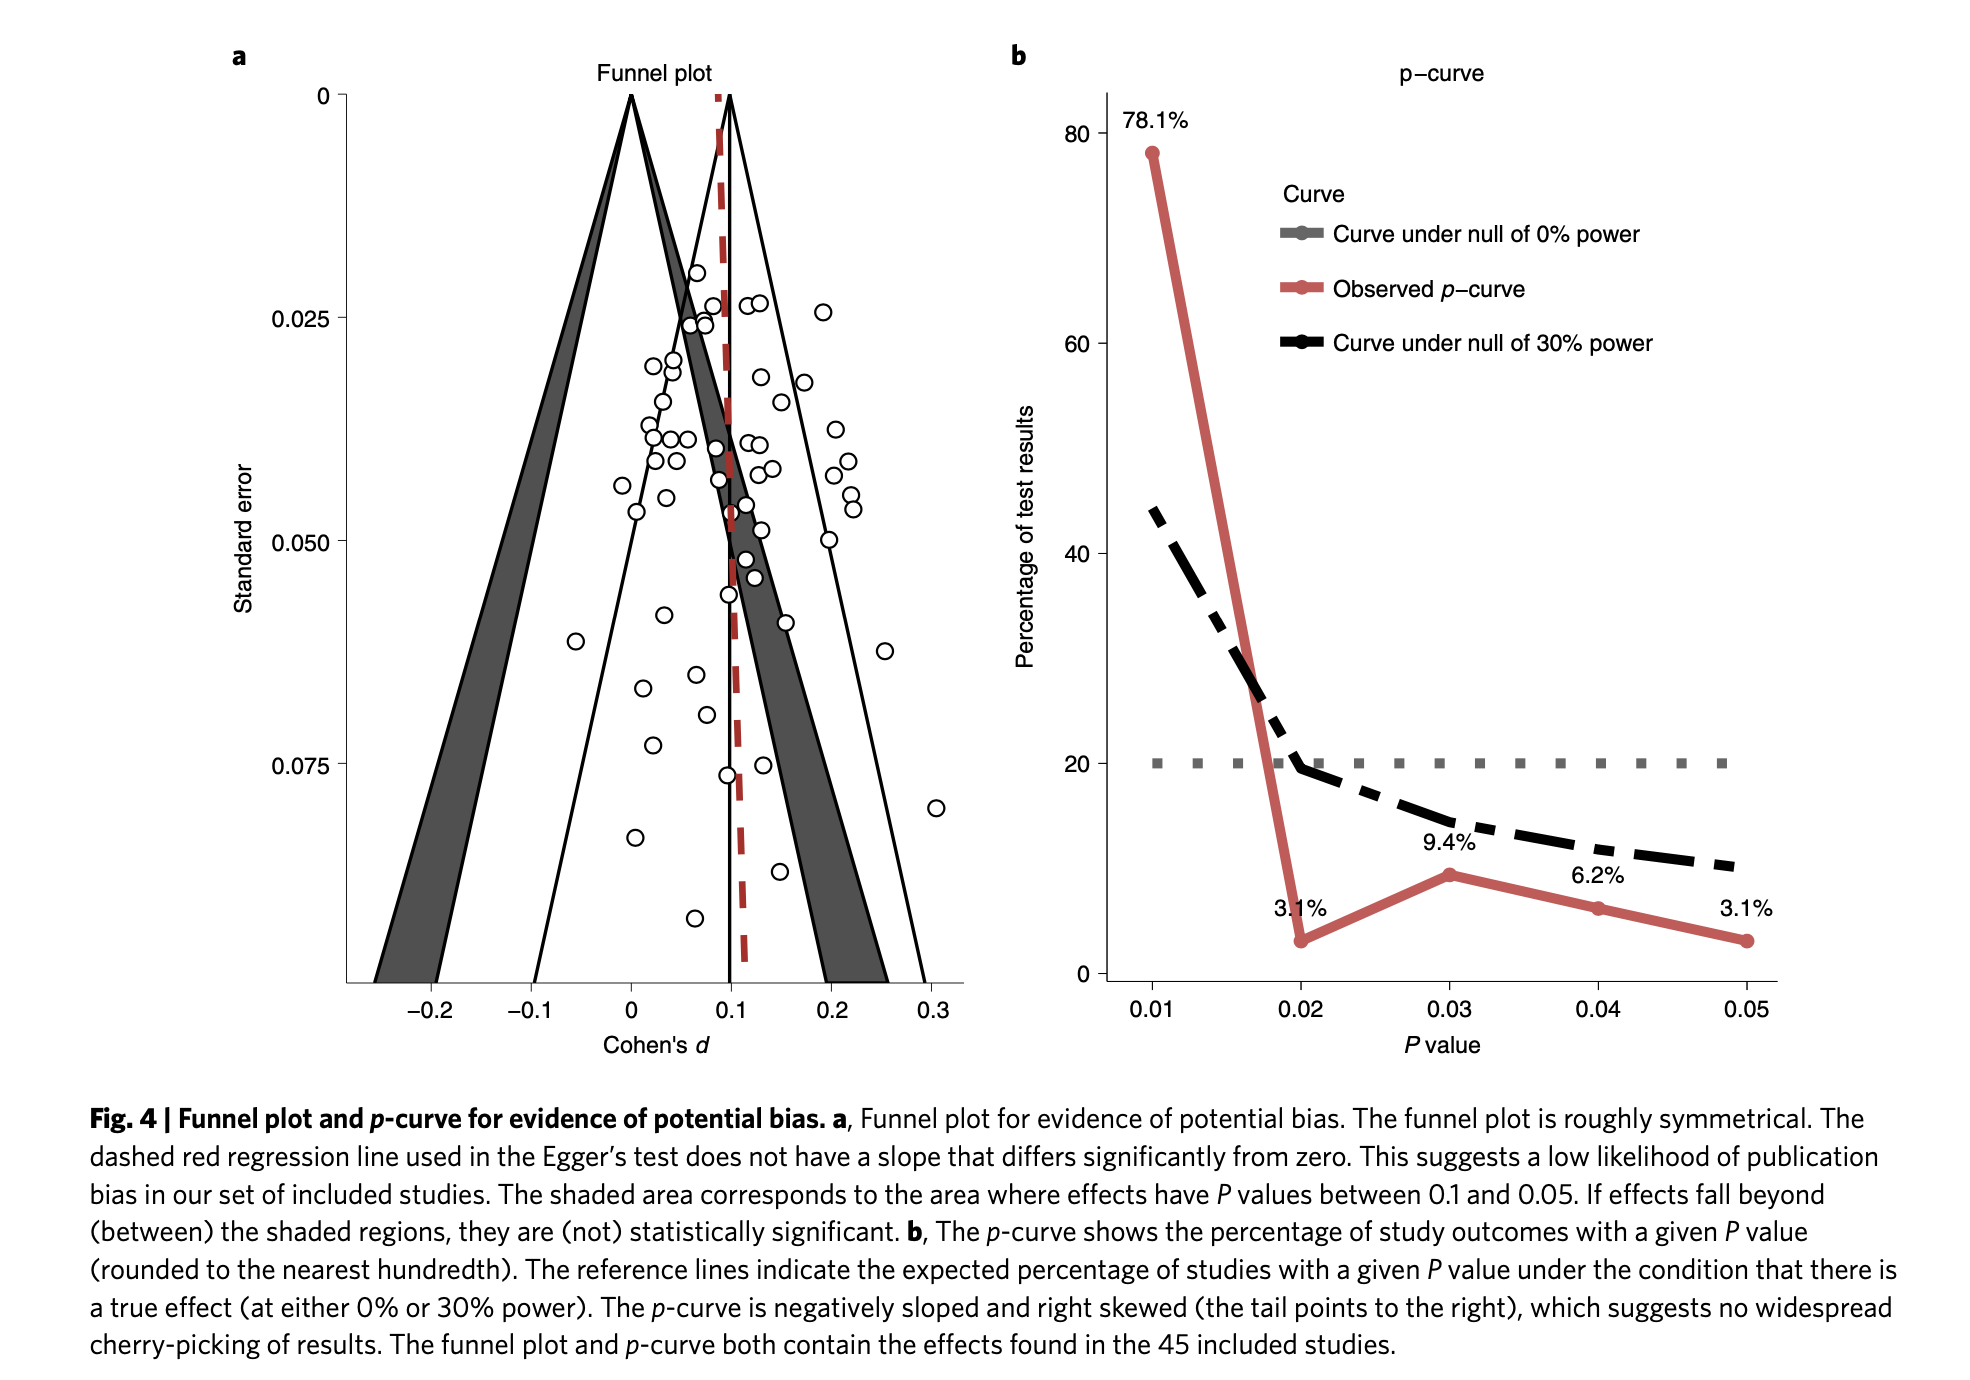
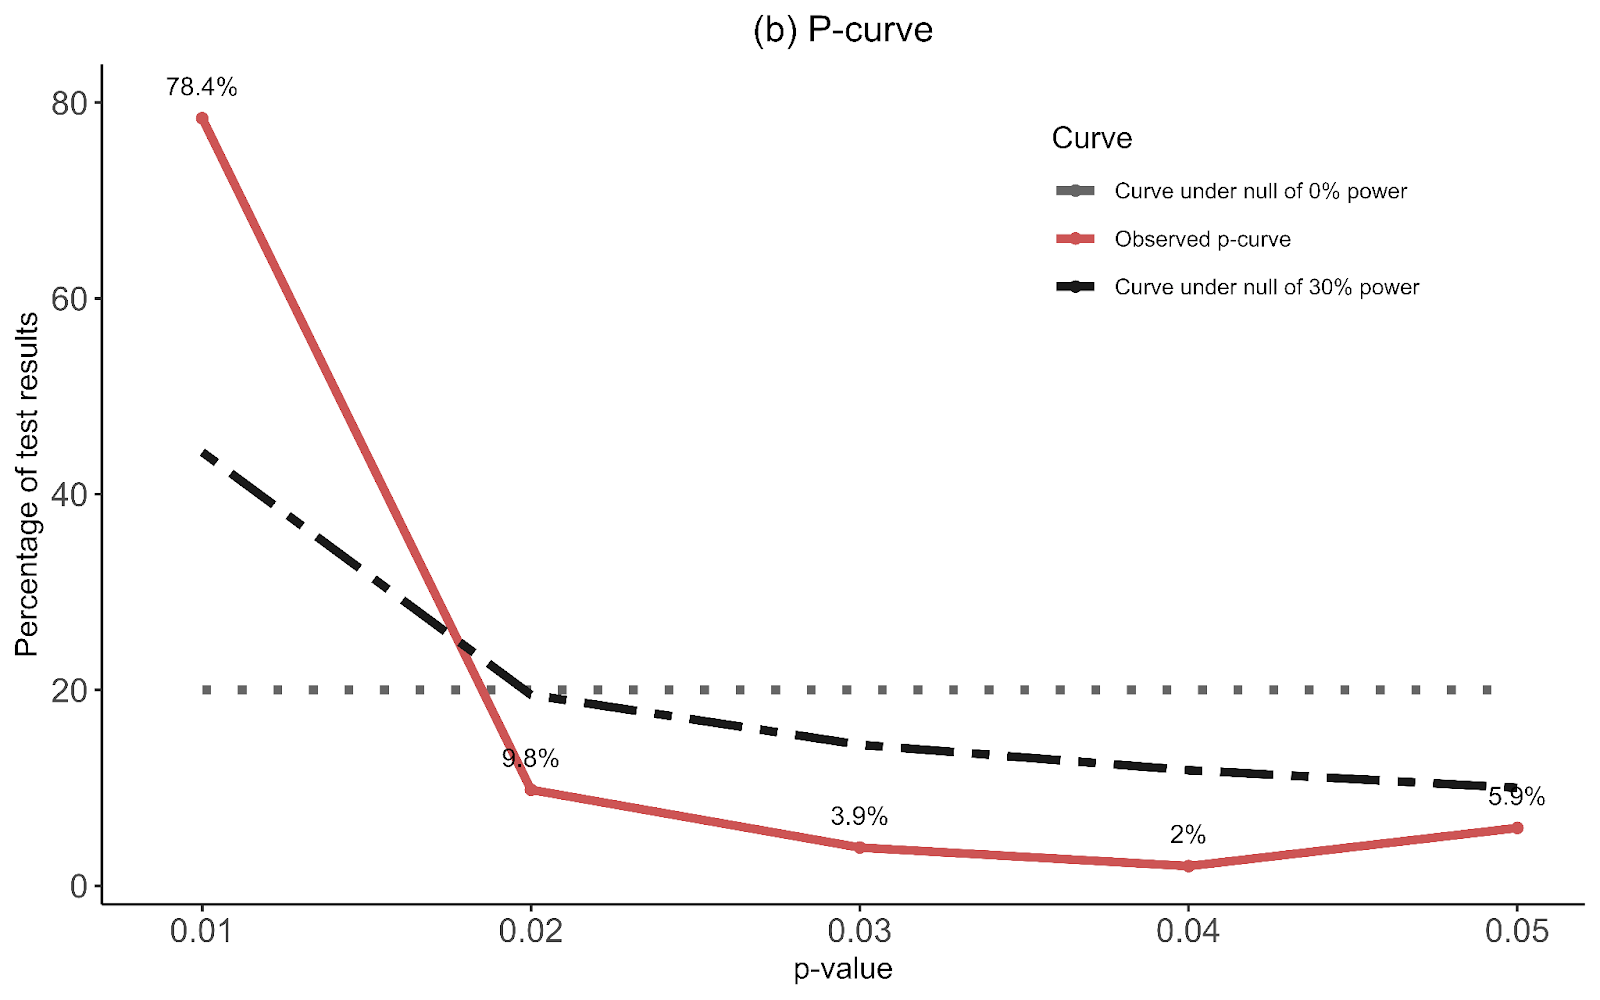
I supplemented this with a newer illustration, the p-curve, meant to detect publication bias that’s not just about the size of an effect, but its precision. The p-curve suggests publication bias if there’s an uptick in the number of effect sizes near the 0.05 significance level relative to the 0.03 or 0.04 level. The idea is that researchers are inclined to fiddle with their specifications until they are significant, but that they’re limited in their ambitions to perform questionable research practices and will tend to push them just over the line. The p-curve for psychotherapy shows a slight uptick near the 0.05 level, compared to none in cash transfers. This is another sign that the psychotherapy evidence base appears to have more publication bias than cash transfers.
Ryan and Gregory rightly pushed me on this – as I didn’t show these figures that make psychotherapy look bad. I have excuses, but they aren’t very good so I won’t repeat them here. I think it’s fair to say that these could have and should have been included.
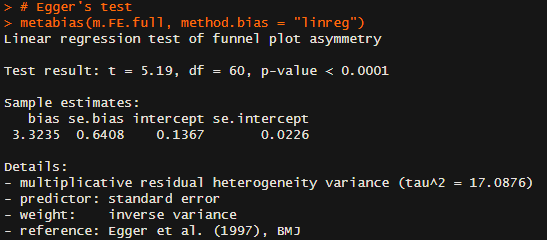
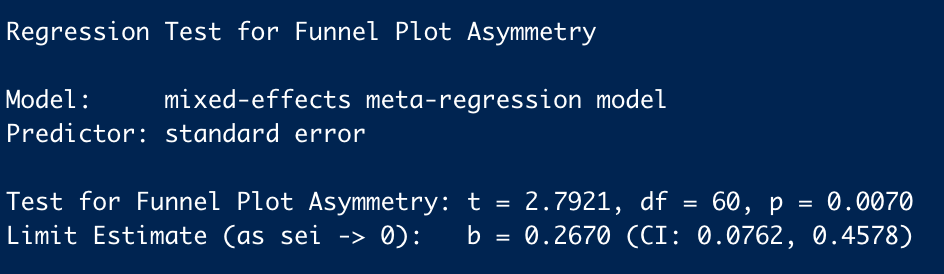
The next, and most concerning point that Ryan and Gregory made was that if we take the Egger regression test seriously (a formal, less eye-bally way of testing for funnel plot asymmetry), it’d indicate that psychotherapy’s effect size should be dramatically reduced[1]. This frankly alarmed me. If this was true, I potentially made a large mistake [2].
2. Does correcting for publication bias substantially change our results?
To investigate this I decided to look into the issue of correcting for publication bias in more depth. To do so I heavily relied upon Harrer et al. (2021), a textbook for doing meta-analyses in R.
My idea for investigating this issue would be to go through every method for correcting publication bias mentioned in Harrer et al. (2021) and show how these methods change the cash transfers to psychotherapy comparison. I thought this would be more reasonable than trying to figure out which one was the method to rule them all. This is also in line with the recommendations of the textbook “No publication bias method consistently outperforms all the others. It is therefore advisable to always apply several techniques…” For those interested in an explanation of the methods, I found Harrer et al. (2021) to be unusually accessible. I don’t expect I’ll do better.
One issue is that these standard approaches don’t seem readily applicable to the models we used. Our models are unusual in that they are 1. Meta-regressions, where we try to explain the variation in effect sizes using study characteristics like time since the intervention ended, and 2. Multi-level meta-analyses that attempt to control for the dependency introduced by adding multiple timepoints or outcomes from a single study. It doesn’t seem like you can easily plug these models into the standard publication bias methods. Because of this uncertainty we tried to run several different types of analyses (see details in 2.1) based on whether a model included the full data or excluded outliers or follow-ups or used a fixed or random effects estimator[3].
I ran (with the help of my colleague Samuel[4]) the corrections for both psychotherapy and cash transfers and then apply the percentage of correction to their cost-effectiveness comparison. It doesn’t seem principled to only run these corrections on psychotherapy. Even though the problem seems worse in psychotherapy, I think the appropriate thing to do is also run these corrections on the cash transfers evidence and see if the correction is greater for psychotherapy.
If you want to go straight to the raw results, I collected them in a spreadsheet that I hope is easy to understand. Finally, if you’re keen on replicating this analysis, we’ve posted the code we used here.
2.1 Model versions
Measures of heterogeneity and publication bias seem to be designed for simpler meta-analysis models than those we use in our analysis. We use a meta-regression with follow-up time (and sometimes dosage), so the estimate of the intercept is affected by the coefficients for time and other variables. Reading through Harrer et al. (2021) and a brief google search didn’t give us much insight as to whether these methods could easily apply to a meta-regression model. Furthermore, most techniques presented by Harrer et al. (2021) used a simple meta-analysis model which employed a different set of R functions (metagen rather than the rma.uni or rma.mv models we use).
Instead, we create a simple meta-analysis model to calculate the intercept for psychotherapy and for cash. We then apply the publication bias corrections to these models and get the % change this created. We then apply the % change of the correction to the effect for psychotherapy and cash and obtain their new cost-effectiveness ratio.
Hence, we are not using the model we directly use in our analysis, but we apply to our analysis the change in effectiveness that the correction method would produce on a model appropriate for said correction method.
Because of our uncertainty, we ran several different types of analyses based on whether a model included the full data[5] or excluded outliers[6] or follow-ups[7] or used a fixed or random effects estimator[8].
2.2 Results
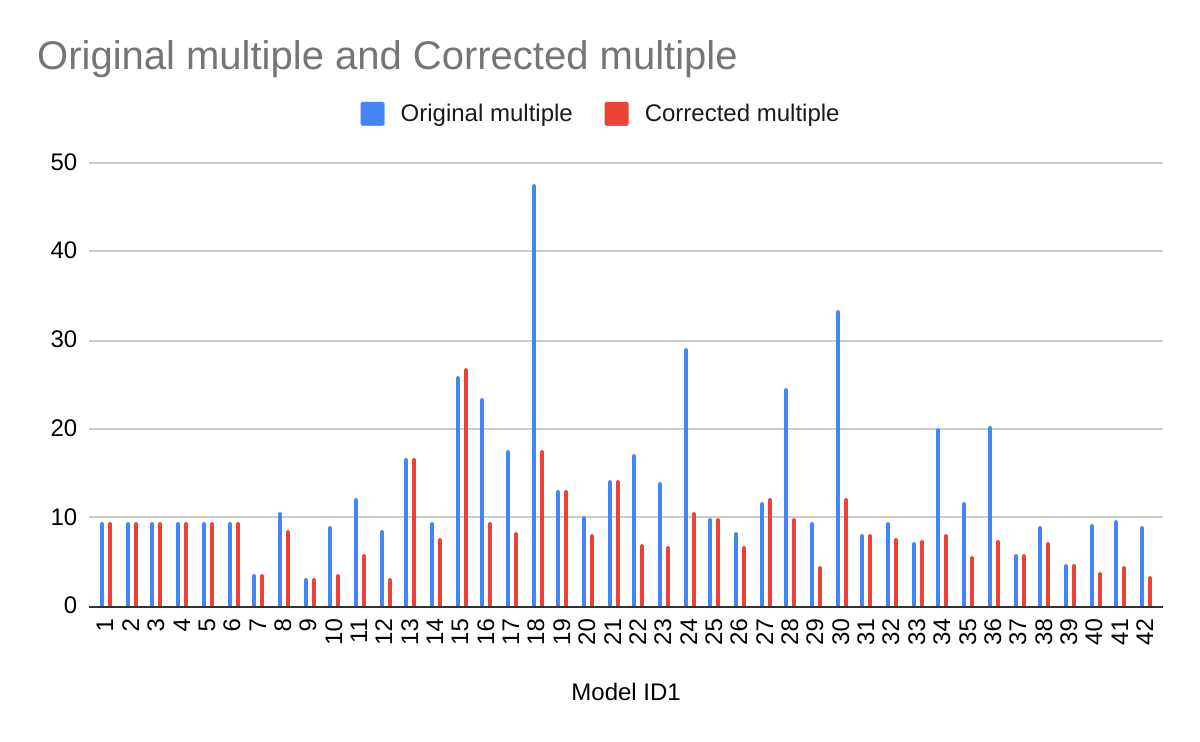
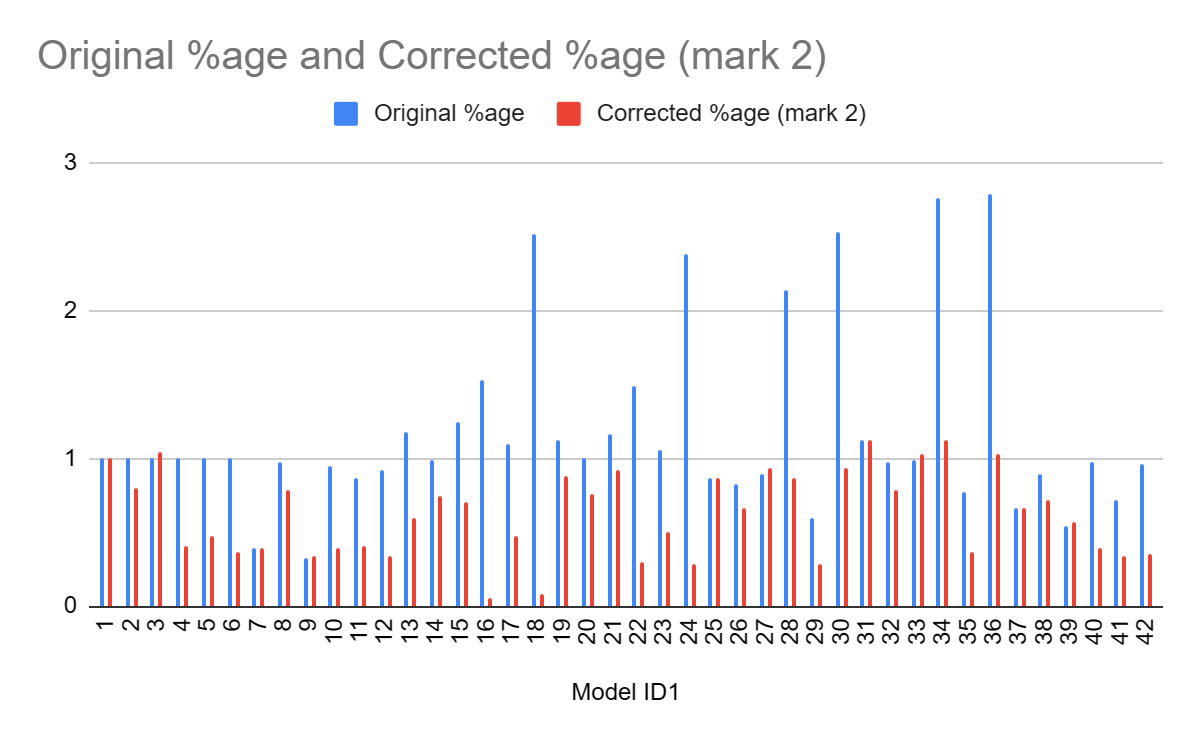
The results of this investigation are shown below. Tests that are to the left of the vertical line represent decreases in the cost-effectiveness of psychotherapy relative to cash transfers. The reference models are the six right on the line (in turquoise). I’ll add further commentary below.
Details of the results can be seen in this spreadsheet. We removed tests 28, 29, 30, 34, 35, 36. These were generally favourable to psychotherapy. We removed them because they were p-curve and Rücker’s limit corrections models that we specified as fixed-effects models but they seemed to force the models into random-effects models, making their addition seem inappropriate[9].
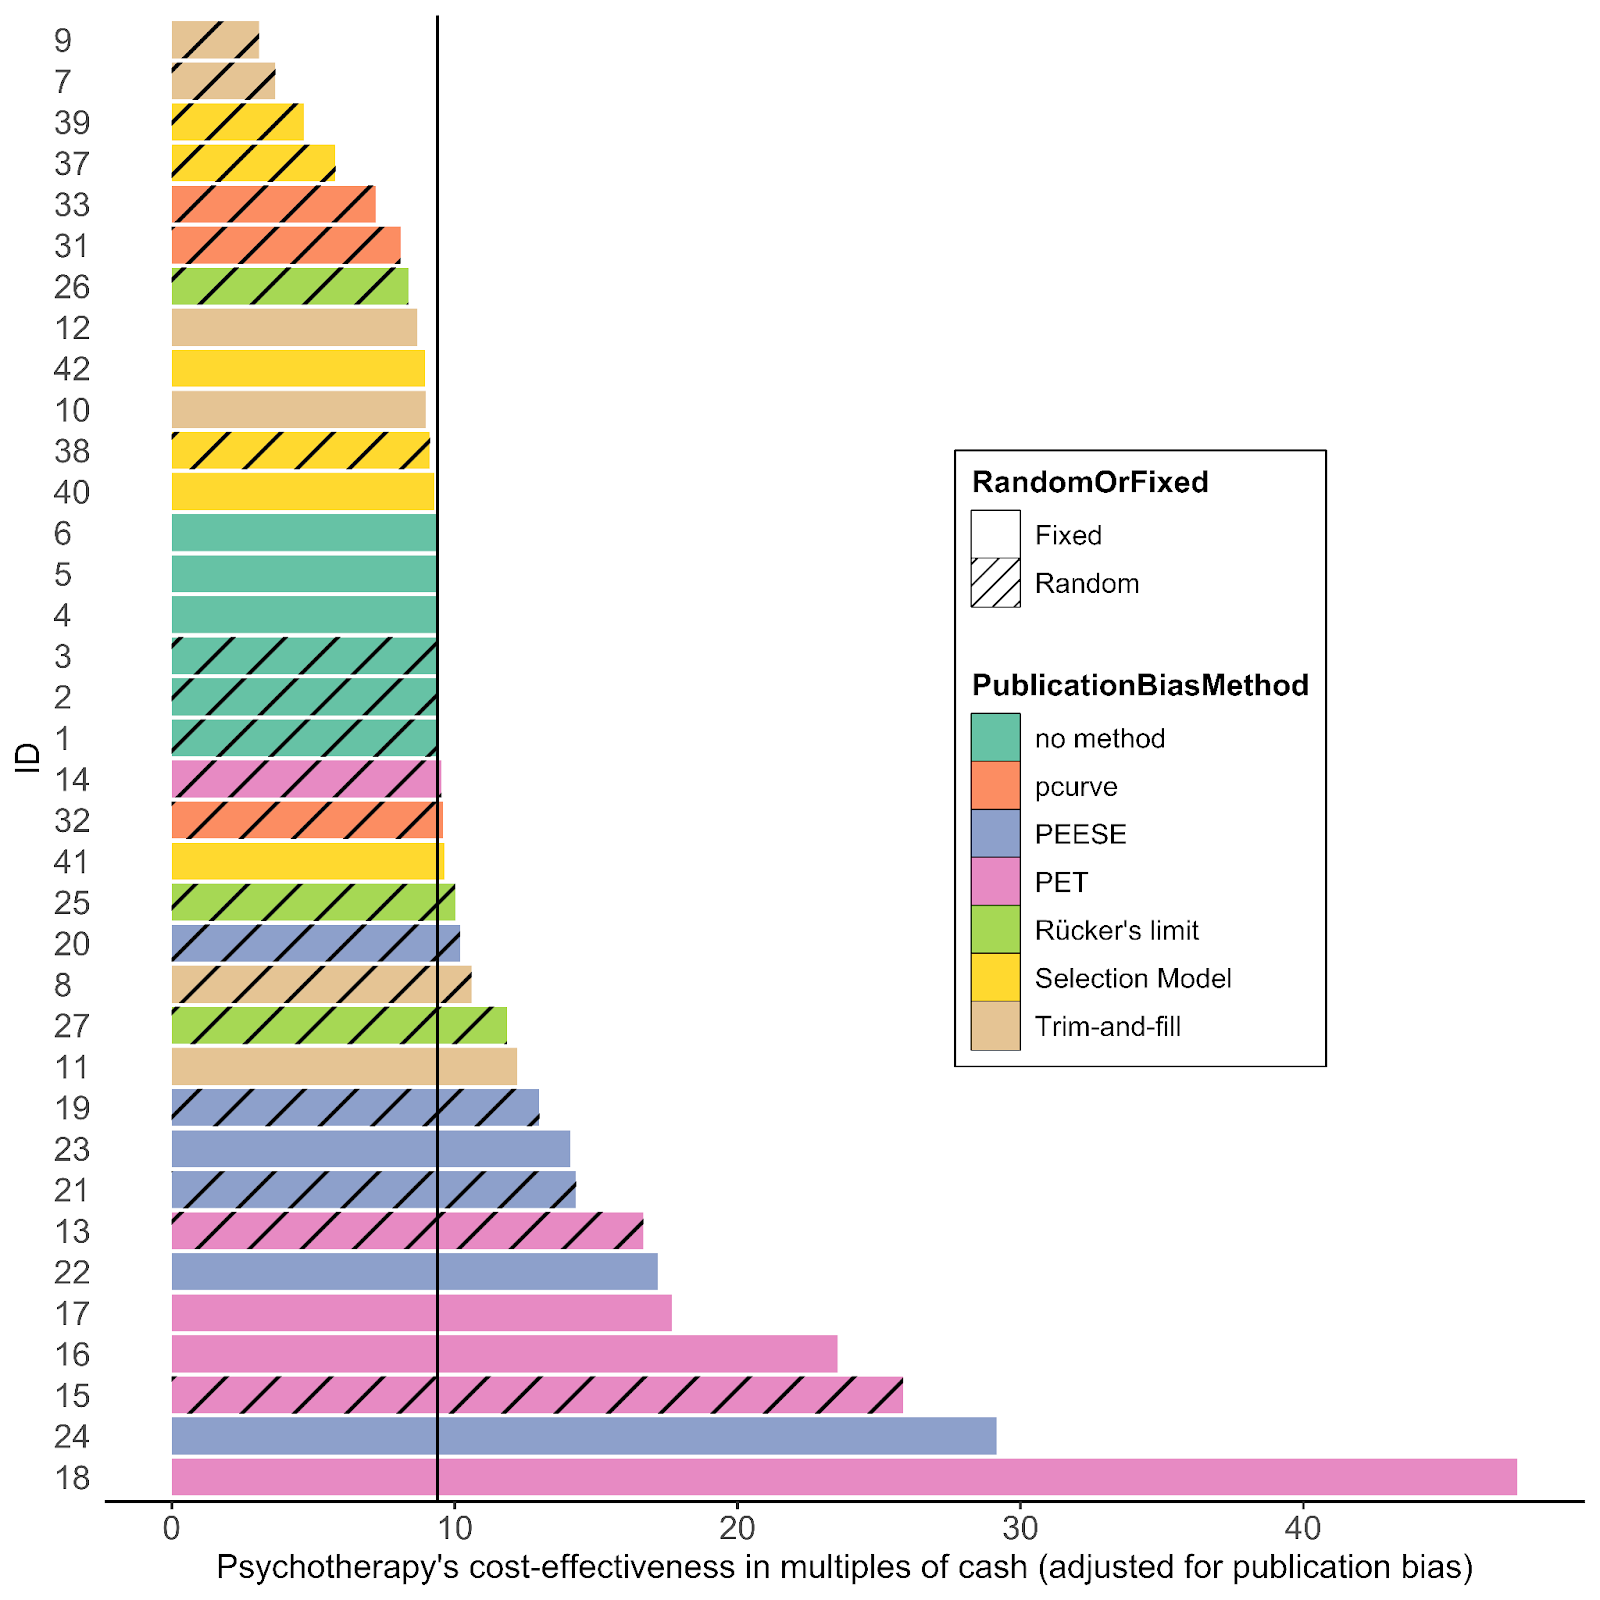
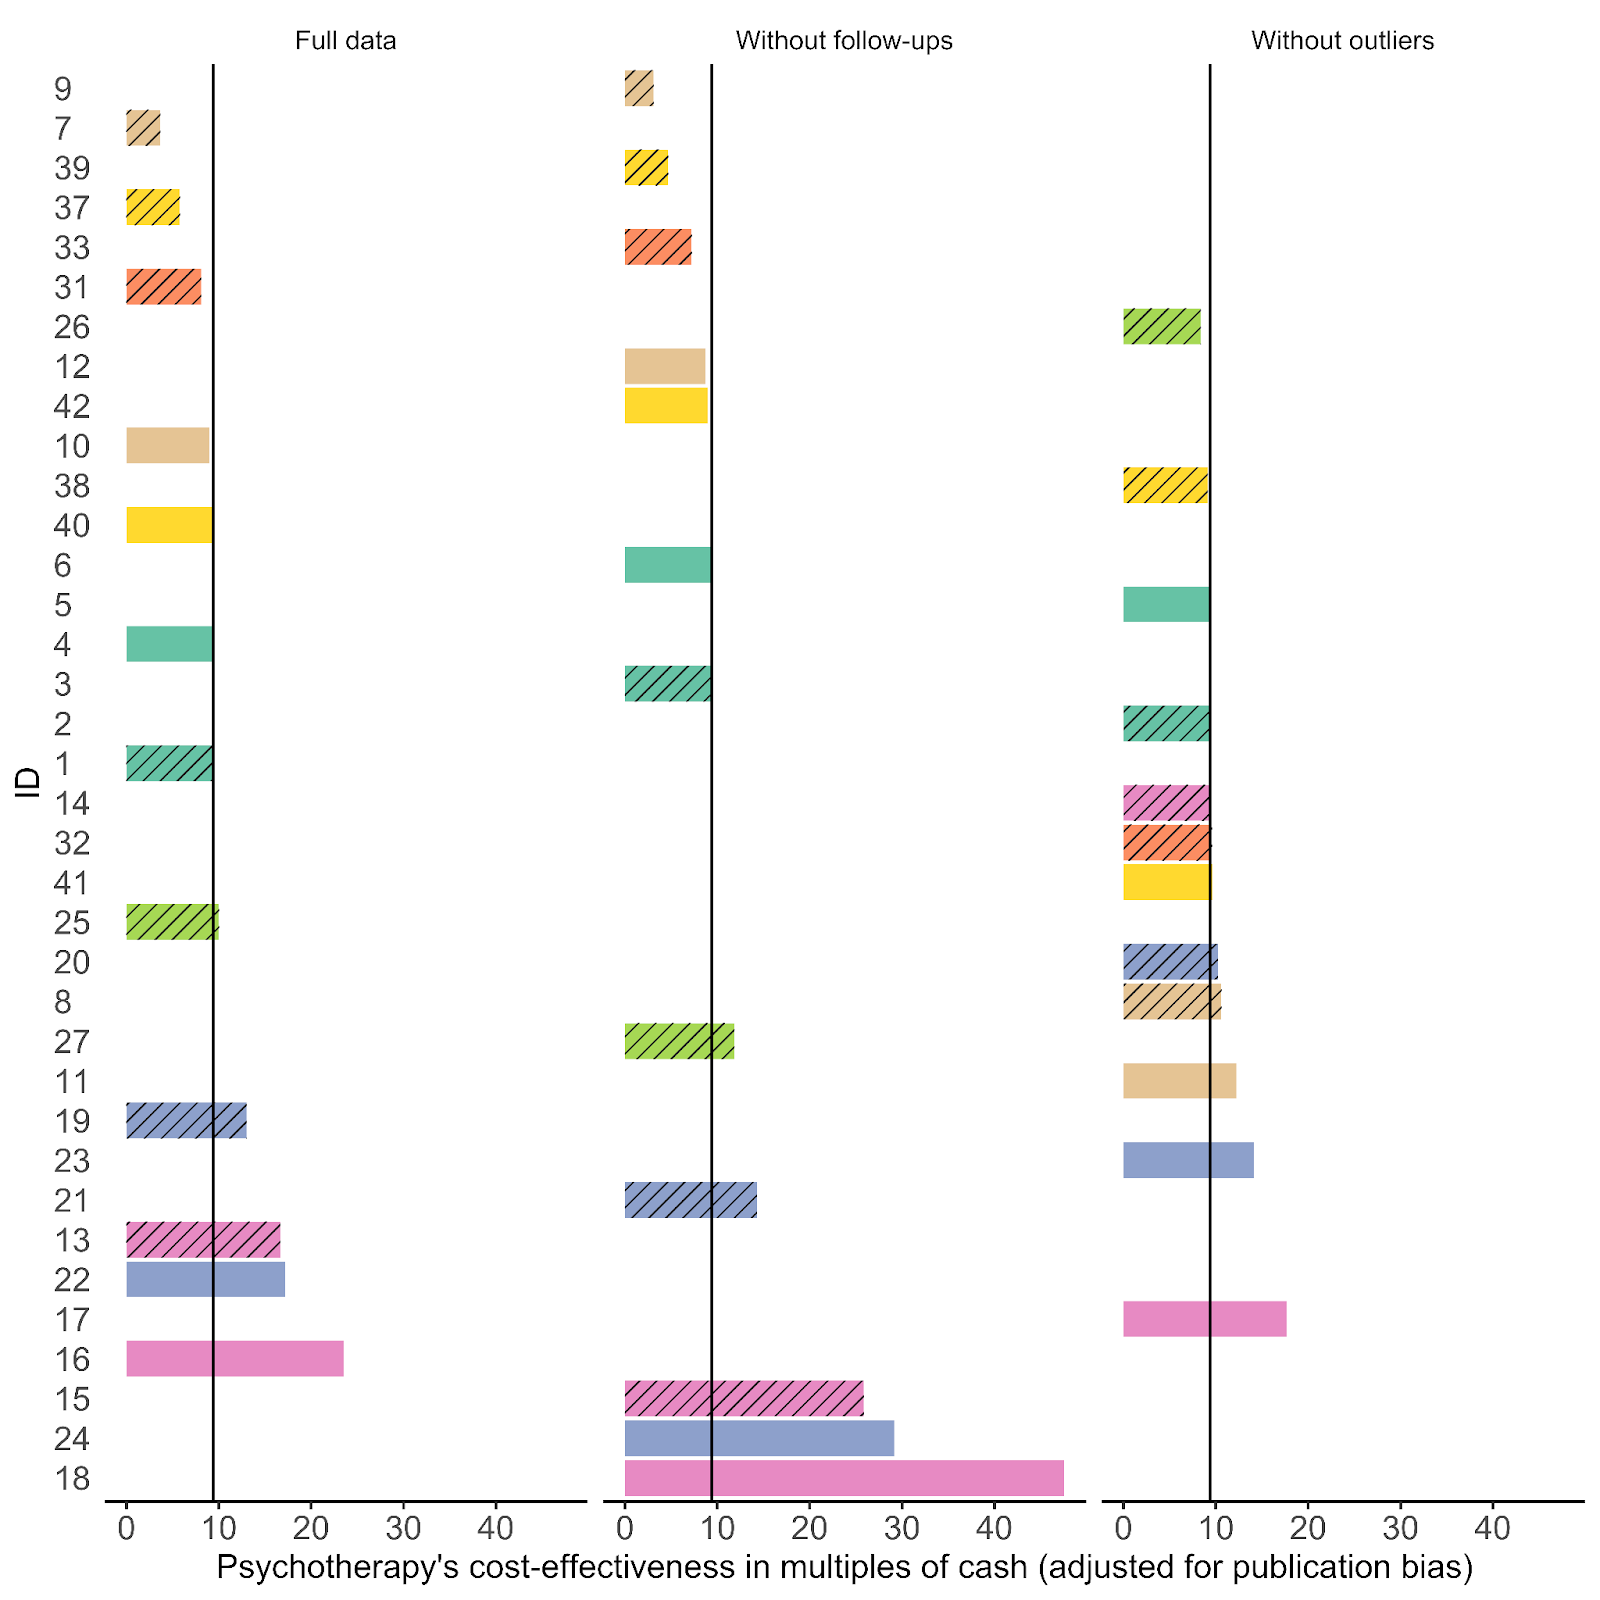
Surprisingly, when we apply these tests, very few dramatically reduce the cost-effectiveness of psychotherapy compared to cash transfers, as indicated by changes to their intercepts / the estimated average overall effect.
- Only four tests show a decrease below 7x for PT.
- The largest correction (using Trim and Fill) reduces PT <> CT from 9.4x to 3.1x as cost-effective as GiveDirectly cash transfers.
- Aside: Given that this appears to be the worst case scenario, I’m not actually sure this would mean we drop our recommendation given that we haven’t found anything clearly better yet (see our analyses of anti-malarial bednets and deworming). I think it’s likelier that we would end up recommending anti-malaria bed nets to those with sympathetic philosophical views.
- The trim and fill and selection models are the ones most consistently negative to PT.
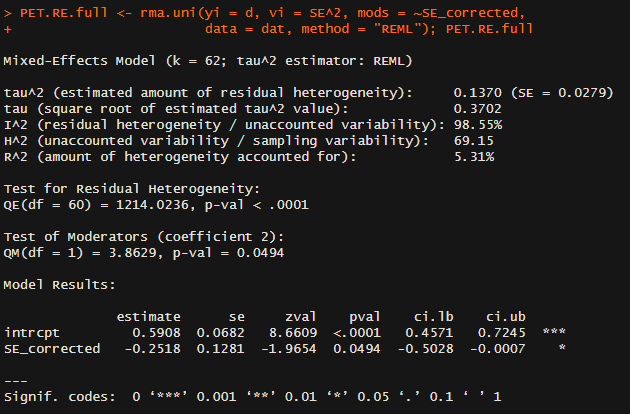
- The worst models for PT are trim and fill, and selection models. But the trim and fill models are the oldest (most outdated?) models that seem to be the least recommended (Harrer et al., (2021) says they are “often outperformed by other methods”). The PET and PEESE models tend to actually make psychotherapy look even better compared to cash transfers.
- Surprisingly, many tests increase the cost-effectiveness ratio in favour of psychotherapy!
2.3 Uncertainties
- A big problem is that most of these tests are sensitive to heterogeneity, so we’re left with a relatively high level of uncertainty in interpreting these results. Are differences between the minimal or most negative update due to the heterogeneity? I’m not sure.
- This should partially be alleviated by adding in the tests with the outliers removed, but while this reduces heterogeneity a bit (PT I^2: 95% → 56%, CT I^2: 75% → 25%), it’s still relatively high.
- Further, the largest downwards adjustment that involves removing outliers is from 9.4x → 7.5x.
- It’s unclear if these publication bias adjustments would differentially affect estimates for the decay rate of the benefit. Our analysis was about the average effect (i.e., the intercept). It’s unclear how publication bias should affect the estimate of the decay rate of psychotherapy (or cash).
2.4 A note about heterogeneity
Sometimes it’s suggested that the high heterogeneity in a meta-analysis means it is impossible to interpret (see details of heterogeneity in my analyses in this spreadsheet). Whilst heterogeneity is important to report and discuss, we don’t think it disqualifies this analysis.
However, high levels of heterogeneity appear to be a common problem with meta-analyses. It’s unclear that this is uniquely a problem with our meta-analysis of psychotherapy. In their big meta-analysis of psychotherapy, Cuijpers et al. (2023; see Table 2) also have high levels of heterogeneity. Our cash transfer meta-analysis also has high (albeit lower than psychotherapy) levels of heterogeneity.
High heterogeneity would be very problematic if it meant the studies are so different they are not measuring the same thing. Alternative explanations are that (1) psychotherapy is a phenomenon with high variance (supported by similar findings of psychotherapy in HICs), and/or (2) studies about psychotherapy in LMICs are few and implemented in different ways, so we expect this data is going to be messy.
3. Next Steps
- 4 tests suggest psychotherapy is 3-7x cash, 8 tests suggest psychotherapy is 7-9.4x cash, and 18 tests suggest psychotherapy is 9.4 or more times cash. Because of the ambiguous nature of the results, I don’t plan on doing anything immediately like suggesting we pause the StrongMinds recommendation.
- However, this analysis and the surrounding discussion has updated me on the importance of updating and expanding the psychotherapy meta-analysis sooner. Here are some things I’d like to commit to:
- Do a systematic search and include all relevant studies, not just a convenience sample.
- Heavily consider including a stricter inclusion criteria. And if we don’t perform more subset analyses and communicate them more clearly.
- Include more analyses that include dosage (how many hours in session) and expertise of the person delivering the therapy.
- Include better data about the control group, paying special attention to whether the control group could be considered as receiving a high, low quality, or no placebo.
- In general, include and present many more robustness checks.
- Add an analogous investigation of publication bias like the one performed here.
- Make our data freely available and our analysis easily replicable at the time of publication.
- Am I missing anything?
- After updating the psychotherapy meta-analysis we will see how it changes our StrongMinds analysis.
- I’ve also expected to make a couple changes to that analysis[10], hopefully incorporating the new Baird et al. RCT. Note if it comes soon and its result strongly diverge from our estimates this could also expedite our re-analysis.
- ^
Note that the Egger regression is a diagnostic test, not a form of correction. However, the PET and PEESE methods are correction methods and are quite similar in structure to the Egger regression test.
- ^
Point taken that the omission is arguably, a non-trivial mistake.
- ^
Choosing a fixed or random effects model is another important and controversial question in modelling meta-analysis and we wanted to test whether the publication bias corrections were particularly sensitive to it. However, it seems like our data is not suitable to the assumptions of a fixed effects model – and this isn’t uncommon. As Harrer et al., (2021) say: “In many fields, including medicine and the social sciences, it is therefore conventional to always use a random-effects model, since some degree of between-study heterogeneity can virtually always be anticipated. A fixed-effect model may only be used when we could not detect any between-study heterogeneity (we will discuss how this is done in Chapter 5) and when we have very good reasons to assume that the true effect is fixed. This may be the case when, for example, only exact replications of a study are considered, or when we meta-analyze subsets of one big study. Needless to say, this is seldom the case, and applications of the fixed-effect model “in the wild'' are rather rare.”
- ^
If my analyses are better in the future, it's because of my colleague Samuel Dupret. Look at the increase in quality between the first cash transfer and psychotherapy reports and the household spillover report. That was months apart. You know what changed? Sam.
- ^
The same data we use in our full models.
- ^
Some methods are not robust to high levels of heterogeneity, which is more often present when there are outliers. We select outliers for the fixed and random effects models based on “‘non-overlapping confidence intervals’ approach, in which a study is defined as an outlier when the 95% confidence interval (CI) of the effect size does not overlap with the 95% CI of the pooled effect size” (Cuijpers et al., 2023; see Harrer et al., 2021 for a more detailed explanation).
- ^
We are concerned that these methods are not made with the assumption of a meta-regression and might react excessively to the follow-up data (i.e., effect sizes other than the earliest effect size collected in a study), which are generally smaller effects (because of decay) with smaller sample sizes (because of attrition).
- ^
Choosing a fixed or random effects model is another important and controversial question in modelling meta-analysis and we wanted to test whether the publication bias corrections were particularly sensitive to it. However, it seems like our data is not suitable to the assumptions of a fixed effects model – and this isn’t uncommon. As Harrer et al., (2021) say: “In many fields, including medicine and the social sciences, it is therefore conventional to always use a random-effects model, since some degree of between-study heterogeneity can virtually always be anticipated. A fixed-effect model may only be used when we could not detect any between-study heterogeneity (we will discuss how this is done in Chapter 5) and when we have very good reasons to assume that the true effect is fixed. This may be the case when, for example, only exact replications of a study are considered, or when we meta-analyze subsets of one big study. Needless to say, this is seldom the case, and applications of the fixed-effect model “in the wild'' are rather rare.”
- ^
The only tests that are different from the random effects ones are 32 and 38 because the list of outliers were different for fixed effects and random effects.
- ^
I expect to assign relatively lower weight to the StrongMinds specific evidence. I was leaning this direction since the summer, but these conversations -- particularly the push from Simon, hardened my views on this. This change would decrease the cost-effectiveness of StrongMinds. Ideally, I’d like to approach the aggregation of the StrongMinds specific and general evidence of lay-group psychotherapy in LMICs in a more formally Bayesian manner, but this would come with many technical difficulties. I will also look into the counterfactual impact of their scaling strategy where they instruct other groups in how to provide group psychotherapy.






I know "top charity" is in the eye of the beholder but I personally think even within the land of nonhuman-excluding non-longtermism it's a bad idea to use "anything better than GiveDirectly = top charity" when GiveWell has a $300 million dollar unmet gap that is 6-9x as good as GiveDirectly, and their core $600 million 2022 giving season ask is all >=10x GiveDirectly.
To be clear, this isn't the bar HLI uses. As I said in section 2:
To elaborate, we interpret "substantially" to mean "around as good as the best charity we've found so far" which is currently 9x GiveDirectly, but I assume the specific number will change over time.
I was trying to propose a possible set of conditions where we could agree that it was reasonable for a charity to be recommended by someone in the EA community. I was aiming for inclusivity here and to leave room for the possibility that Founder's Pledge may have good reasons I'm not privy to for using GiveDirectly as a bar.
I'm also unsure that GiveWell's bar will generalise to other types of analyses. i.e., I think it's very plausible that other evaluators find that cash transfers are much better than GiveWell does.
Agreed. For what it's worth GWWC also uses a higher threshold than the 1x cash this post advocates.